|
Most ManagePLUS windows display data in a grid, and ManagePLUS grids have a number of features in common. Grid features are quick and easy to use because most of them work visually: you just drag a column heading or make a couple mouse clicks to affect how your data is displayed. This lesson shows how to use ManagePLUS grids by demonstrating grid features of the Transactions window. (Some of the features you’ll work with here are not available in all windows.) Open the Transactions window before starting if it is not already open. Here’s a screen shot of the window with some grid (and related) features labeled, as a reference for the discussion below:
Resetting the grid (to default settings) The techniques described in this topic all share a common hazard: they make it possible to rearrange the grid to the point that figuring out how to “change it back to the way it was” can be difficult. If that happens there’s an easy way out: you can reset the grid to return it to its default (as-designed) settings:
Choosing columns to show or hide Often you may want to show fewer columns than are available. Especially if you are getting ready to print or export the grid, you may want to limit the columns it displays. Here’s one of the ways to do that.
Another way to hide/show grid columns is with the Column Chooser window. For details see Choosing and arranging grid columns, in How-To Procedures. You can drag column headings to different positions to change the column order:
For more information see Choosing and arranging grid columns, in How-To Procedures. To sort by any column of the grid:
The grid will immediately be sorted by the column you clicked, and the column header will display a sort order indicator: a small triangle that points upward when the column is sorted in forward/alphabetical order, and downward when the column is sorted in reverse order.
To reverse the sort order:
The sort order will immediately be reversed, as the sort order indicator shows.
You can sort by several columns at once if you want. For more information, see the How To topic Sorting grids. You can organize grid data into groups based on the contents of specific column(s). Let’s group the grid by the Account and Class columns.
The grid will then be grouped by Account and by Class (i.e., with classes as subgroups of accounts) and should look something like the screen shot farther below (after you’ve expanded groups in the next step).
Here’s the Transactions window grid grouped by Account and by Class:
For more information, see the How To Procedures topic, Grouping grids. Filtering: limiting what gets displayed
The grid will then only display transactions for that vendor:
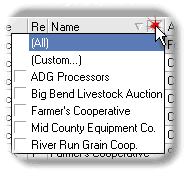
How do you un-filter a grid? Click on the column’s filtering button again, but this time select the (All) item at the top of the list:
|


